Zeitpunkt              Nutzer    Delta   Tröts        TNR     Titel                     Version  maxTL
So 14.07.2024 00:00:27    22.188      -1    2.971.924   133,9 Mastodon                  4.2.10     500
Sa 13.07.2024 00:01:05    22.189       0    2.970.295   133,9 Mastodon                  4.2.10     500
Fr 12.07.2024 00:01:45    22.189      +3    2.968.200   133,8 Mastodon                  4.2.10     500
Do 11.07.2024 00:01:05    22.186      +2    2.966.470   133,7 Mastodon                  4.2.10     500
Mi 10.07.2024 00:01:05    22.184      +5    2.964.257   133,6 Mastodon                  4.2.10     500
Di 09.07.2024 00:01:07    22.179      +3    2.961.976   133,5 Mastodon                  4.2.10     500
Mo 08.07.2024 00:01:15    22.176      +2    2.959.737   133,5 Mastodon                  4.2.10     500
So 07.07.2024 00:01:05    22.174       0    2.957.624   133,4 Mastodon                  4.2.10     500
Sa 06.07.2024 00:01:05    22.174      +2    2.955.640   133,3 Mastodon                  4.2.10     500
Fr 05.07.2024 00:01:07    22.172       0    2.953.229   133,2 Mastodon                  4.2.10     500
Energy Monitor 🇩🇪 (@energy) · 07/2023 · Tröts: 62 · Folger: 373
So 14.07.2024 19:01
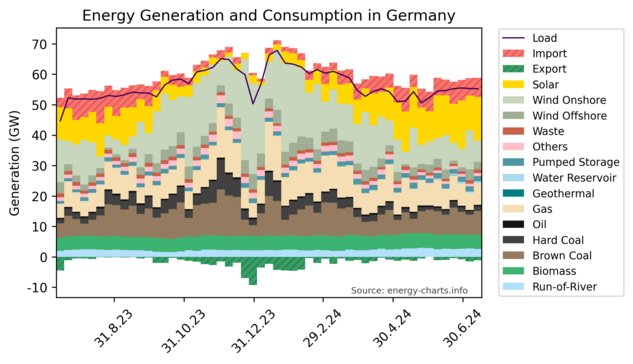
Weekly update on long-term trends in ⚡️ electricity generation in Germany
7 Days:
🌿 Renewable: 61.3% | Imports: 11.3%
🌞 Solar: 26.3%, 💨 Wind: 18.8%, ⛰️ Coal: 17.7%, 🔥 Gas: 13.4%, 🌊 Hydropower: 9.9%, 🍃 Biomass: 8.8%, ♻️ Waste: 2.3%, ⚡️ Others: 1.9%, 🛢️ Oil: 1.0%
365 Days:
🌿 Renewable: 56.6% | Imports: 8.0%
💨 Wind: 29.8%, ⛰️ Coal: 20.5%, 🔥 Gas: 15.6%, 🌞 Solar: 13.2%, 🍃 Biomass: 8.4%, 🌊 Hydropower: 6.9%, ⚡️ Others: 2.8%, ♻️ Waste: 1.9%, 🛢️ Oil: 0.9%

Stacked bar graph showing Germany's energy generation sources and energy consumption in the last 365 days.
[Öffentlich] Antw.: 0 Wtrl.: 0 Fav.: 0