Zeitpunkt              Nutzer    Delta   Tröts        TNR     Titel                     Version  maxTL
So 07.07.2024 00:01:05   229.834     +87   16.931.802    73,7 Mastodon 🐘                4.3.0...   500
Sa 06.07.2024 00:01:05   229.747     +84   16.926.091    73,7 Mastodon 🐘                4.3.0...   500
Fr 05.07.2024 00:00:51   229.663    +114   16.916.454    73,7 Mastodon 🐘                4.3.0...   500
Do 04.07.2024 00:00:49   229.549      +1   16.902.639    73,6 Mastodon 🐘                4.3.0...   500
Mi 03.07.2024 00:00:06   229.548      -5   16.887.661    73,6 Mastodon 🐘                4.3.0...   500
Di 02.07.2024 00:01:44   229.553      +1   16.872.533    73,5 Mastodon 🐘                4.3.0...   500
Mo 01.07.2024 00:00:13   229.552     +73   16.860.740    73,5 Mastodon 🐘                4.3.0...   500
So 30.06.2024 00:00:09   229.479     +81   16.849.111    73,4 Mastodon 🐘                4.3.0...   500
Sa 29.06.2024 00:01:13   229.398     +72   16.834.671    73,4 Mastodon 🐘                4.3.0...   500
Fr 28.06.2024 00:01:07   229.326       0   16.821.035    73,3 Mastodon 🐘                4.3.0...   500
JohnMashey (@JohnMashey) · 11/2022 · Tröts: 1.651 · Folger: 952
So 07.07.2024 09:31
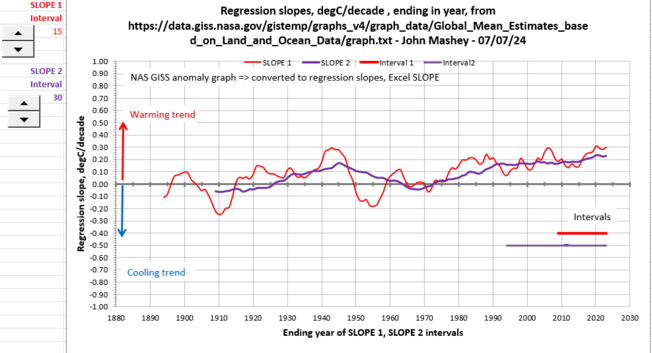
3/ Of course, for real climate change, people tend to use longer intervals, so here's the same thing with 15 (red) and 30 (purple) years.
As usual, the shorter interval jiggles more, but neither is negative after 1972.
From 1990-2016, the 30-year purple line shows .15-.19 degC increase/decade, then by 2020 reaches/exceeds .2C/decade,
or 2C/century.
(In the actual spreadsheet, the up and down arrows let one raise and lower the interval sizes, akin to a interactive slider bar to see the effects.)

Regression slope charts, 15- and 30-year intervals, 1880-2023.
[Öffentlich] Antw.: 0 Wtrl.: 0 Fav.: 0 · via Web