Zeitpunkt              Nutzer    Delta   Tröts        TNR     Titel                     Version  maxTL
So 14.07.2024 00:00:24   230.360     -66   17.024.521    73,9 Mastodon 🐘                4.3.0...   500
Sa 13.07.2024 00:01:05   230.426     +77   17.011.148    73,8 Mastodon 🐘                4.3.0...   500
Fr 12.07.2024 00:01:45   230.349    +102   16.997.332    73,8 Mastodon 🐘                4.3.0...   500
Do 11.07.2024 00:00:08   230.247     +96   16.986.698    73,8 Mastodon 🐘                4.3.0...   500
Mi 10.07.2024 00:00:15   230.151    +117   16.972.485    73,7 Mastodon 🐘                4.3.0...   500
Di 09.07.2024 00:01:07   230.034    +122   16.958.186    73,7 Mastodon 🐘                4.3.0...   500
Mo 08.07.2024 00:00:26   229.912     +78   16.944.690    73,7 Mastodon 🐘                4.3.0...   500
So 07.07.2024 00:01:05   229.834     +87   16.931.802    73,7 Mastodon 🐘                4.3.0...   500
Sa 06.07.2024 00:01:05   229.747     +84   16.926.091    73,7 Mastodon 🐘                4.3.0...   500
Fr 05.07.2024 00:00:51   229.663       0   16.916.454    73,7 Mastodon 🐘                4.3.0...   500
ilias :thepiratebay: (@DM_Ronin) · 04/2022 · Tröts: 297 · Folger: 355
So 14.07.2024 10:54
Check out this fascinating research about a patch that resolves tracking devices over Bluetooth entirely
#Privacy #Bluetooth #Embedded #Hardware #Surveillance #BLE

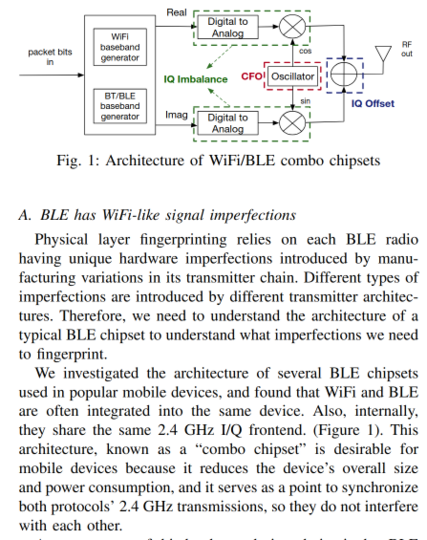
Fig. 1: Architecture of WiFi/BLE combo chipsets Arrow with text "packet bits in" to the rectangle that has two rectangles with texts "WiFi baseband generator" and "BT/BLE baseband generator". From there, it goes two ways: "Real" and "Imag". Each has "Digital to Analog" rectangle (both lead with arrows to the left for "IQ Imbalance") with an arrow to the path mixer. Both path mixers have two arrow: one lead from "Oscillator" (and CFO) to it, to "Real" with cos, to "Imag" with sin, another leads to summer amplifier with IQ Offset label, which goes to "RF out" buffer A. BLE has WiFi-like signal imperfections Physical layer fingerprinting relies on each BLE radio having unique hardware imperfections introduced by manu- facturing variations in its transmitter chain. Different types of imperfections are introduced by different transmitter architec- tures. Therefore, we need to understand the architecture of a typical BLE chipset to understand what imperfections we need to fingerprint. We investigated the architecture of several BLE chipsets used in popular mobile devices, and found that WiFi and BLE are often integrated into the same device. Also, internally, they share the same 2.4 GHz I/Q frontend. (Figure 1). This architecture, known as a “combo chipset” is desirable for mobile devices because it reduces the device’s overall size and power consumption, and it serves as a point to synchronize both protocols’ 2.4 GHz transmissions, so they do not interfere with each other.

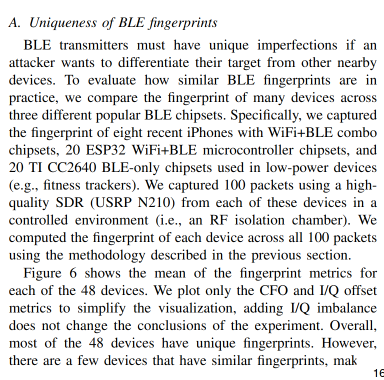
A. Uniqueness of BLE fingerprints BLE transmitters must have unique imperfections if an attacker wants to differentiate their target from other nearby devices. To evaluate how similar BLE fingerprints are in practice, we compare the fingerprint of many devices across three different popular BLE chipsets. Specifically, we captured the fingerprint of eight recent iPhones with WiFi+BLE combo chipsets, 20 ESP32 WiFi+BLE microcontroller chipsets, and 20 TI CC2640 BLE-only chipsets used in low-power devices (e.g., fitness trackers). We captured 100 packets using a high- quality SDR (USRP N210) from each of these devices in a controlled environment (i.e., an RF isolation chamber). We computed the fingerprint of each device across all 100 packets using the methodology described in the previous section. Figure 6 shows the mean of the fingerprint metrics for each of the 48 devices. We plot only the CFO and I/Q offset metrics to simplify the visualization, adding I/Q imbalance does not change the conclusions of the experiment. Overall, most of the 48 devices have unique fingerprints. However, there are a few devices that have similar fingerprints, making them more difficult to uniquely identify. The distribution of device fingerprints also appears to be dependent on the chipset. Namely, there are striking differences in how the I/Q offset metric is distributed between different chipsets. For instance, the ESP32 devices have a much larger range of I/Q offsets than the iPhones

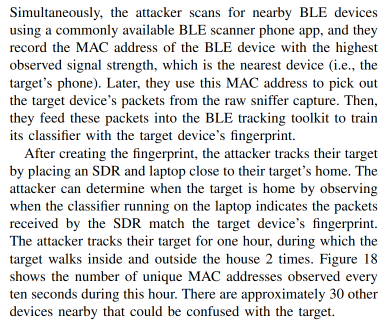
Simultaneously, the attacker scans for nearby BLE devices using a commonly available BLE scanner phone app, and they record the MAC address of the BLE device with the highest observed signal strength, which is the nearest device (i.e., the target’s phone). Later, they use this MAC address to pick out the target device’s packets from the raw sniffer capture. Then, they feed these packets into the BLE tracking toolkit to train its classifier with the target device’s fingerprint. After creating the fingerprint, the attacker tracks their target by placing an SDR and laptop close to their target’s home. The attacker can determine when the target is home by observing when the classifier running on the laptop indicates the packets received by the SDR match the target device’s fingerprint. The attacker tracks their target for one hour, during which the target walks inside and outside the house 2 times. Figure 18 shows the number of unique MAC addresses observed every ten seconds during this hour. There are approximately 30 other devices nearby that could be confused with the target.

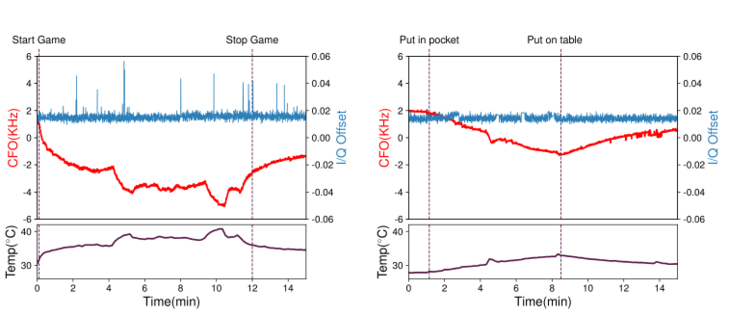
Fig. 8: Metric stability while playing a GPU-intensive game CFO (Carrier Frequency Offset, an offset in the carrier frequency generated by the RF frontend’s local oscillator. The carrier frequency is ideally exactly the center frequency of the channel in use. However, imperfections in the radio’s local oscillator, a crystal oscillator, yields a unique CFO added to every transmission) I/Q Offset is created by two different imperfections in the RF frontend: (1) the carrier frequency signal leaking through the mixer into the transmitted signal, or (2) the baseband signal having a DC offset. I/Q offset results in a fixed complex term added to each received I/Q sample (i.e., a shift in the center of the constellation)) Two graphs Top graph Left vertical axis: CFO, measured in KHz, figure displays range from -6 to 6 Right vertical axis: I/Q Offset, ange in the graph from -0.06 to 0.06 Bottom horizontal axis: Temp (Celsius), between 25 and 40 degrees Changes: when the game begins, the CFO increases, and when the game ends, it decreases. At the peak internal temperature (+10°C above baseline), a significant CFO deviation happens of 7 KHz. I/Q metric is stable but with some spikes Fig. 9: Metric stability while putting the phone in a pocket Graphs same as in Fig. 8 Compared to Fig.8, I/Q offset is stable, but CFO changes are still significant (2 KHz)
[Öffentlich] Antw.: 0 Wtrl.: 0 Fav.: 0