Zeitpunkt              Nutzer    Delta   Tröts        TNR     Titel                     Version  maxTL
Mo 12.08.2024 00:00:00 2.045.539  +1.270  100.192.858    49,0 Mastodon                  4.3.0...   500
So 11.08.2024 00:00:10 2.044.269  +1.003  100.082.452    49,0 Mastodon                  4.3.0...   500
Sa 10.08.2024 00:00:04 2.043.266  +1.405   99.975.166    48,9 Mastodon                  4.3.0...   500
Fr 09.08.2024 00:00:03 2.041.861  +1.420   99.897.120    48,9 Mastodon                  4.3.0...   500
Do 08.08.2024 00:00:05 2.040.441  +1.475   99.776.486    48,9 Mastodon                  4.3.0...   500
Mi 07.08.2024 00:00:00 2.038.966  +1.512   99.648.476    48,9 Mastodon                  4.3.0...   500
Di 06.08.2024 00:00:00 2.037.454    +848   99.526.992    48,8 Mastodon                  4.3.0...   500
Mo 05.08.2024 00:00:05 2.036.606  +1.142   99.411.663    48,8 Mastodon                  4.3.0...   500
So 04.08.2024 00:00:02 2.035.464  +1.127   99.305.991    48,8 Mastodon                  4.3.0...   500
Sa 03.08.2024 00:00:01 2.034.337       0   99.209.982    48,8 Mastodon                  4.3.0...   500
ErsatzCulture (@ErsatzCulture) · 10/2020 · Tröts: 403 · Folger: 88
Mo 12.08.2024 13:32
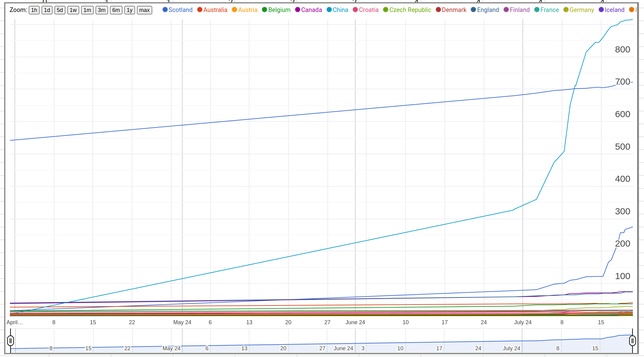
Note: I suspect there was more than just "Finalist X" involved in shenanigans. I need to spend more time to write this up, but see this timeline chart of supporting membership counts over the past few weeks. Note how China & later Scotland are different from other countries.
NB, this chart is a bit misleading, as I wasn't properly tracking the membership data until the end of June. In reality I think Chinese supporting memberships were very low until quite a bit later than the chart implies.

A timeline chart derived from the Supporting member demographic information published on the Glasgow Worldcon website. It shows that China and then later Scotland have late spurts of growth. Note that I wasn't actively grabbing data until the end of June; I suspect that until some time in the latter half of June, the Chinese supporting memberships were much lower than this chart implies.
[Öffentlich] Antw.: 0 Wtrl.: 0 Fav.: 0 · via Web