Zeitpunkt              Nutzer    Delta   Tröts        TNR     Titel                     Version  maxTL
Sa 07.09.2024 00:01:08    11.963      -1    1.067.096    89,2 Mastodon.green            4.2.10     500
Fr 06.09.2024 00:01:11    11.964       0    1.065.926    89,1 Mastodon.green            4.2.10     500
Do 05.09.2024 00:01:10    11.964       0    1.064.915    89,0 Mastodon.green            4.2.10     500
Mi 04.09.2024 00:00:21    11.964       0    1.063.931    88,9 Mastodon.green            4.2.10     500
Di 03.09.2024 00:00:14    11.964      -1    1.062.856    88,8 Mastodon.green            4.2.10     500
Mo 02.09.2024 00:00:13    11.965       0    1.065.443    89,0 Mastodon.green            4.2.10     500
So 01.09.2024 00:00:55    11.965       0    1.064.312    89,0 Mastodon.green            4.2.10     500
Sa 31.08.2024 00:01:17    11.965       0    1.063.361    88,9 Mastodon.green            4.2.10     500
Fr 30.08.2024 00:01:12    11.965       0    1.062.460    88,8 Mastodon.green            4.2.10     500
Do 29.08.2024 00:01:09    11.965       0    1.061.297    88,7 Mastodon.green            4.2.10     500
Peter du Toit (@peterdutoit) · 04/2022 · Tröts: 189 · Folger: 2.172
Sa 07.09.2024 10:49
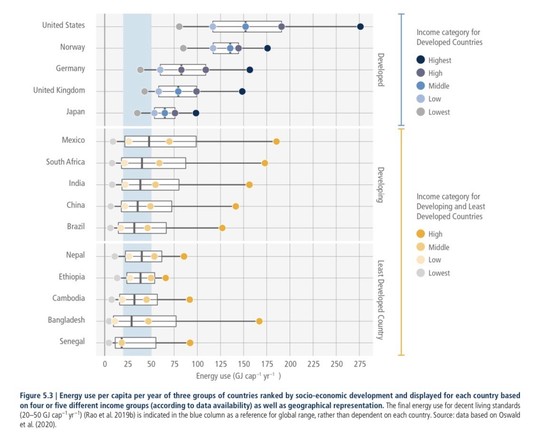
The report also highlights this inconvenient truth.
There are populations in entire countries and groups within countries who are using way WAY more energy than is required for a decent living standard.
Take a look:
#EnergyEfficiency #Mitigation

Figure 5.3 | Energy use per capita per year of three groups of countries ranked by socio-economic development and displayed for each country based on four or five different income groups (according to data availability) as well as geographical representation. The tinal energy use for decent living standards (20-50 GJ cap-' vr-1) (Rao et al. 20196) is indicated in the blue column as a reference for global range, rather than dependent on each country. Source: data based on Oswald et al. (2020).
[Öffentlich] Antw.: 0 Wtrl.: 1 Fav.: 1 · via IceCubesApp