Zeitpunkt              Nutzer    Delta   Tröts        TNR     Titel                     Version  maxTL
Mo 22.07.2024 00:01:10    61.959      +1    3.567.825    57,6 Fosstodon                 4.2.10     500
So 21.07.2024 00:01:07    61.958      +1    3.564.861    57,5 Fosstodon                 4.2.10     500
Sa 20.07.2024 00:01:10    61.957      +1    3.561.604    57,5 Fosstodon                 4.2.10     500
Fr 19.07.2024 13:57:34    61.956      -1    3.558.474    57,4 Fosstodon                 4.2.10     500
Do 18.07.2024 00:00:27    61.957      +1    3.553.476    57,4 Fosstodon                 4.2.10     500
Mi 17.07.2024 00:01:10    61.956      -1    3.550.157    57,3 Fosstodon                 4.2.10     500
Di 16.07.2024 00:00:36    61.957      +6    3.547.999    57,3 Fosstodon                 4.2.10     500
Mo 15.07.2024 00:00:01    61.951      +1    3.544.794    57,2 Fosstodon                 4.2.10     500
So 14.07.2024 00:00:00    61.950      +2    3.542.390    57,2 Fosstodon                 4.2.10     500
Sa 13.07.2024 00:00:08    61.948       0    3.539.632    57,1 Fosstodon                 4.2.10     500
Martin Fleischmann (@martinfleis) · 11/2022 · Tröts: 228 · Folger: 462
Mo 22.07.2024 10:38
The inclusion of spatial modelling 'on top' of the predictions from the CNN proved to consistently improve the performance of the modelling pipeline, while some other techniques showed occasional success.
In the end, we managed to improve the accuracy of the prediction by almost 0.2 in some cases, bringing the quality of the tricky signature prediction up to the level of common land use or land cover prediction models.

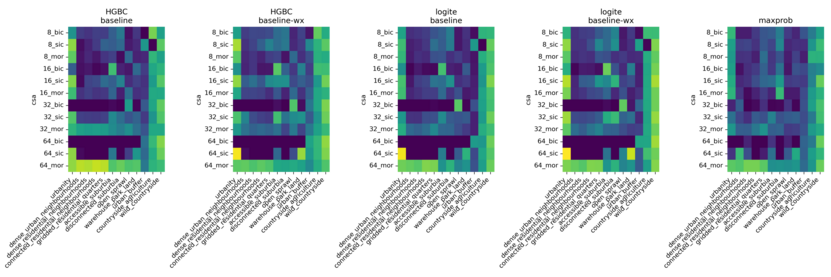
Within-class accuracy scores grouped by model. Each panel represents results from one of the five models compared, namely: histogram-based boosted classifier (HGBC) with features pertaining only to a given chip (baseline) or including also features from neighbouring ones (baseline-wx); Logit ensemble (logite) with the same two variations; and a simpler maximum probability approach (maxprob). Each row in the heatmap corresponds to a pair of chipsize (8, 16, 32, and 64 pixels) and architechture (baseline image classification, or bic; sliding image classification, or sic; and multi-output regression, or mor) used in the neural network stage of the pipeline. Colouring is standardised across panels and values range from 0 (dark purple) to 1 (bright yellow). (For interpretation of the references to colour in this figure legend, the reader is referred to the web version of this article.)

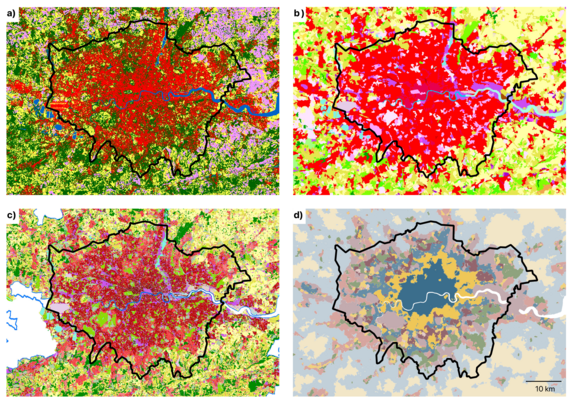
A visual comparison between established LULC products and spatial signatures. Panel a) shows the WorldCover classification by ESA ( Zanaga et al., 2021 ), panel b) shows the CORINE land cover classification ( European Environment Agency, 1990 ), panel c shows the Copernicus Urban Atlas ( European Environment Agency and European Environment Agency, 2020 , and panel d shows the British spatial signatures ( Fleischmann & Arribas-Bel, 2022 ). The latter is the focus of this paper. The direct comparison showcases the major difference between the conceptualisation of urban areas between different classifications, with traditional LULC providing only a mimimal disticntion between types of urban development, whilst spatial signatures provide a much more nuanced view, allowing a different type of understanding of the environment.
[Öffentlich] Antw.: 0 Wtrl.: 0 Fav.: 0