Zeitpunkt              Nutzer    Delta   Tröts        TNR     Titel                     Version  maxTL
Mi 17.07.2024 00:01:10    61.956      -1    3.550.157    57,3 Fosstodon                 4.2.10     500
Di 16.07.2024 00:00:36    61.957      +6    3.547.999    57,3 Fosstodon                 4.2.10     500
Mo 15.07.2024 00:00:01    61.951      +1    3.544.794    57,2 Fosstodon                 4.2.10     500
So 14.07.2024 00:00:00    61.950      +2    3.542.390    57,2 Fosstodon                 4.2.10     500
Sa 13.07.2024 00:00:08    61.948      +1    3.539.632    57,1 Fosstodon                 4.2.10     500
Fr 12.07.2024 00:01:45    61.947      +6    3.537.376    57,1 Fosstodon                 4.2.10     500
Do 11.07.2024 00:00:37    61.941     +12    3.533.951    57,1 Fosstodon                 4.2.10     500
Mi 10.07.2024 00:00:53    61.929      +5    3.530.507    57,0 Fosstodon                 4.2.10     500
Di 09.07.2024 00:00:08    61.924      +2    3.527.175    57,0 Fosstodon                 4.2.10     500
Mo 08.07.2024 00:00:19    61.922       0    3.524.369    56,9 Fosstodon                 4.2.10     500
Achim Zeileis (@zeileis) · 11/2022 · Tröts: 626 · Folger: 856
Mi 17.07.2024 12:01
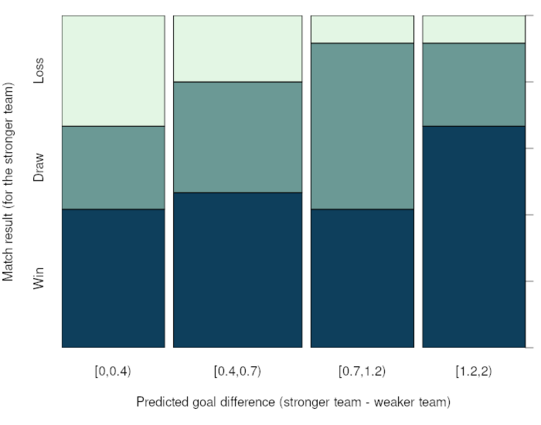
The spineplot (flavor of stacked barplot) shows how the observed proportions of win/draw/lose for the stronger team changes with our predicted goal difference.
Again, by and large, the observations and predictions align very well.

Spineplot of match result (win/draw/loss for the stronger team) vs. predicted goal difference. As expected, the probability to win increases with the predicted goal difference while the probability to lose decreases.
[Öffentlich] Antw.: 0 Wtrl.: 0 Fav.: 0