Zeitpunkt              Nutzer    Delta   Tröts        TNR     Titel                     Version  maxTL
Mi 10.07.2024 00:03:45     5.529      +2      504.578    91,3 FediScience.org           4.2.10     500
Di 09.07.2024 00:03:52     5.527      +1      504.079    91,2 FediScience.org           4.2.10     500
Mo 08.07.2024 00:04:00     5.526       0      503.594    91,1 FediScience.org           4.2.10     500
So 07.07.2024 00:02:18     5.526       0      503.145    91,1 FediScience.org           4.2.10     500
Sa 06.07.2024 00:03:24     5.526       0      502.766    91,0 FediScience.org           4.2.10     500
Fr 05.07.2024 00:01:10     5.526      +1      502.208    90,9 FediScience.org           4.2.10     500
Do 04.07.2024 00:02:56     5.525      -1      501.688    90,8 FediScience.org           4.2.7      500
Mi 03.07.2024 00:00:21     5.526       0      501.149    90,7 FediScience.org           4.2.7      500
Di 02.07.2024 00:03:56     5.526      +2      500.546    90,6 FediScience.org           4.2.7      500
Mo 01.07.2024 00:02:35     5.524       0      500.052    90,5 FediScience.org           4.2.7      500
Zack Labe (@ZLabe) · 11/2022 · Tröts: 2.241 · Folger: 9.892
Mi 10.07.2024 01:38
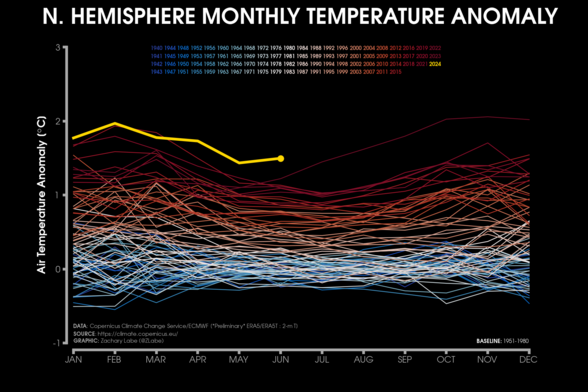
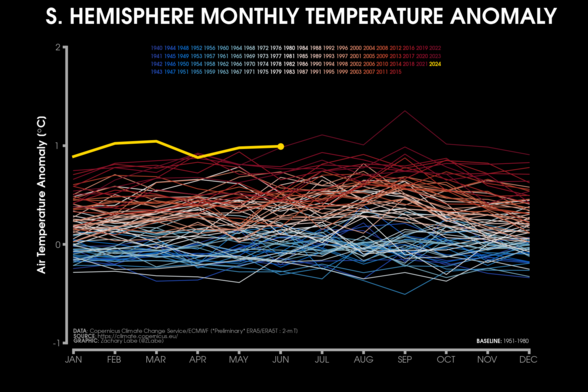
Looking at the different seasonality and trends in the magnitude of monthly temperature anomalies since 1940 for the Northern Hemisphere and Southern Hemisphere. 2024 is a historically warm year.

Line graph time series of monthly mean surface temperature anomalies for the Northern Hemisphere region only. Every month is shown from 1940 to 2024. There is a long-term warming trend in all months of the year.

Line graph time series of monthly mean surface temperature anomalies for the Southern Hemisphere region only. Every month is shown from 1940 to 2024. There is a long-term warming trend in all months of the year.
[Öffentlich] Antw.: 1 Wtrl.: 2 Fav.: 3 · via Web