Zeitpunkt              Nutzer    Delta   Tröts        TNR     Titel                     Version  maxTL
Do 11.07.2024 00:03:49     5.529       0      505.006    91,3 FediScience.org           4.2.10     500
Mi 10.07.2024 00:03:45     5.529      +2      504.578    91,3 FediScience.org           4.2.10     500
Di 09.07.2024 00:03:52     5.527      +1      504.079    91,2 FediScience.org           4.2.10     500
Mo 08.07.2024 00:04:00     5.526       0      503.594    91,1 FediScience.org           4.2.10     500
So 07.07.2024 00:02:18     5.526       0      503.145    91,1 FediScience.org           4.2.10     500
Sa 06.07.2024 00:03:24     5.526       0      502.766    91,0 FediScience.org           4.2.10     500
Fr 05.07.2024 00:01:10     5.526      +1      502.208    90,9 FediScience.org           4.2.10     500
Do 04.07.2024 00:02:56     5.525      -1      501.688    90,8 FediScience.org           4.2.7      500
Mi 03.07.2024 00:00:21     5.526       0      501.149    90,7 FediScience.org           4.2.7      500
Di 02.07.2024 00:03:56     5.526       0      500.546    90,6 FediScience.org           4.2.7      500
Zack Labe (@ZLabe) · 11/2022 · Tröts: 2.242 · Folger: 9.894
Do 11.07.2024 02:02
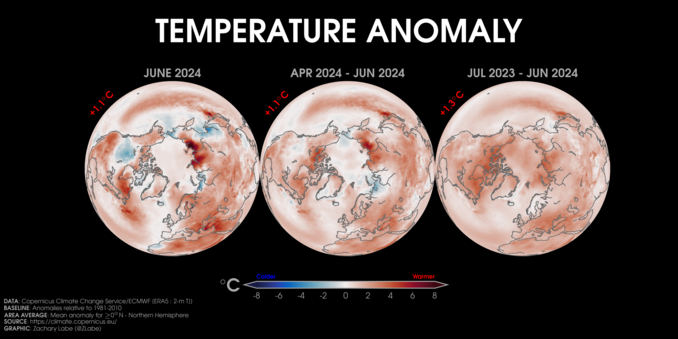
Temperature anomalies over the last month (left), 3 months (center), and 12 months (right) across the Northern Hemisphere. The largest anomaly (by magnitude) was along the Arctic Ocean coast in Siberia.
Data from @CopernicusECMWF ERA5 reanalysis at https://cds.climate.copernicus.eu/cdsapp#!/dataset/reanalysis-era5-single-levels-monthly-means?tab=overview

Three orthographic maps showing 2-m air temperature anomalies in June 2024, April 2024 to June 2024, and July 2023 to June 2024. Red shading is shown for warmer anomalies, and blue shading is shown for colder anomalies. Most areas are warmer than average. The mean temperature anomaly for each map is also displayed. Anomalies are calculated relative to a 1981-2010 baseline.
[Öffentlich] Antw.: 0 Wtrl.: 0 Fav.: 2 · via Web