Zeitpunkt              Nutzer    Delta   Tröts        TNR     Titel                     Version  maxTL
Di 06.08.2024 00:00:09     5.534      +1      518.344    93,7 FediScience.org           4.2.10     500
Mo 05.08.2024 00:00:21     5.533       0      517.842    93,6 FediScience.org           4.2.10     500
So 04.08.2024 00:03:40     5.533       0      517.470    93,5 FediScience.org           4.2.10     500
Sa 03.08.2024 00:03:48     5.533      +1      516.926    93,4 FediScience.org           4.2.10     500
Fr 02.08.2024 00:04:14     5.532      +1      516.348    93,3 FediScience.org           4.2.10     500
Do 01.08.2024 00:00:58     5.531       0      515.720    93,2 FediScience.org           4.2.10     500
Mi 31.07.2024 00:03:11     5.531       0      515.162    93,1 FediScience.org           4.2.10     500
Di 30.07.2024 00:02:57     5.531       0      514.522    93,0 FediScience.org           4.2.10     500
Mo 29.07.2024 00:00:47     5.531      +1      514.020    92,9 FediScience.org           4.2.10     500
So 28.07.2024 00:00:02     5.530       0      513.540    92,9 FediScience.org           4.2.10     500
Zack Labe (@ZLabe) · 11/2022 · Tröts: 2.319 · Folger: 10.004
Di 06.08.2024 23:20
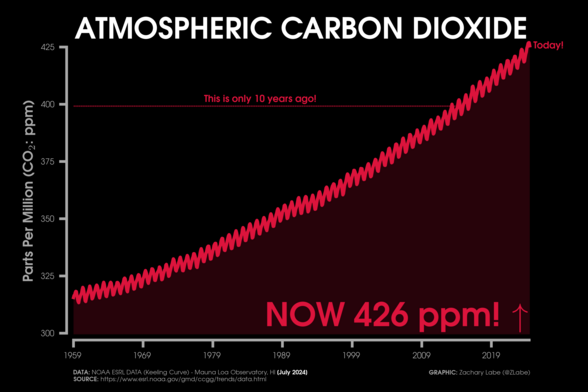
Carbon dioxide (CO₂) averaged 425.5 ppm in July 2024
10 years ago July averaged about 399 ppm
Preliminary data: https://gml.noaa.gov/ccgg/trends/

Red line graph time series of monthly carbon dioxide abundance from January 1959 through July 2024. There is a seasonal cycle and long-term increasing trend. Current levels of CO2 are at 426 ppm. This is the Keeling Curve graph. A line for CO2 10 years ago is also annotated.
[Öffentlich] Antw.: 0 Wtrl.: 6 Fav.: 7 · via Web