Zeitpunkt              Nutzer    Delta   Tröts        TNR     Titel                     Version  maxTL
Di 06.08.2024 00:00:09     5.534      +1      518.344    93,7 FediScience.org           4.2.10     500
Mo 05.08.2024 00:00:21     5.533       0      517.842    93,6 FediScience.org           4.2.10     500
So 04.08.2024 00:03:40     5.533       0      517.470    93,5 FediScience.org           4.2.10     500
Sa 03.08.2024 00:03:48     5.533      +1      516.926    93,4 FediScience.org           4.2.10     500
Fr 02.08.2024 00:04:14     5.532      +1      516.348    93,3 FediScience.org           4.2.10     500
Do 01.08.2024 00:00:58     5.531       0      515.720    93,2 FediScience.org           4.2.10     500
Mi 31.07.2024 00:03:11     5.531       0      515.162    93,1 FediScience.org           4.2.10     500
Di 30.07.2024 00:02:57     5.531       0      514.522    93,0 FediScience.org           4.2.10     500
Mo 29.07.2024 00:00:47     5.531      +1      514.020    92,9 FediScience.org           4.2.10     500
So 28.07.2024 00:00:02     5.530       0      513.540    92,9 FediScience.org           4.2.10     500
Zack Labe (@ZLabe) · 11/2022 · Tröts: 2.317 · Folger: 10.003
Di 06.08.2024 14:17
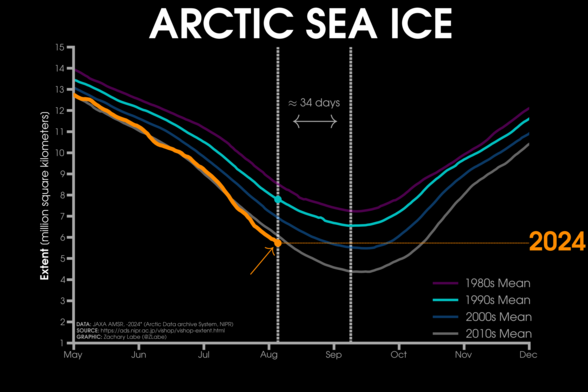
#Arctic sea ice extent has already dropped well below what used to be the average annual minimum in the 1990s (and 1980s). Again, the "melt season" typically ends in September.
+ Additional graphs: https://zacklabe.com/arctic-sea-ice-figures/
+ Small differences will exist between different datasets

Orange line graph time series of 2024's daily Arctic sea ice extent compared to decadal averages from the 1980s to the 2010s, which are shown with different colored lines. 2024 is now below the minimum extent in the 1990s by more than 34 days earlier. A seasonal cycle is shown on the graph. There is a long-term decreasing trend evident in every day of the year on this graphic.
[Öffentlich] Antw.: 0 Wtrl.: 4 Fav.: 5 · via Web