Zeitpunkt              Nutzer    Delta   Tröts        TNR     Titel                     Version  maxTL
Mo 09.09.2024 00:00:16     5.560      +1      534.147    96,1 FediScience.org           4.2.10     500
So 08.09.2024 00:01:41     5.559       0      533.751    96,0 FediScience.org           4.2.10     500
Sa 07.09.2024 00:03:40     5.559       0      533.373    95,9 FediScience.org           4.2.10     500
Fr 06.09.2024 00:04:23     5.559      -2      532.871    95,9 FediScience.org           4.2.10     500
Do 05.09.2024 00:01:27     5.561      -1      532.300    95,7 FediScience.org           4.2.10     500
Mi 04.09.2024 00:00:25     5.562      +2      531.844    95,6 FediScience.org           4.2.10     500
Di 03.09.2024 00:01:17     5.560      +1      531.302    95,6 FediScience.org           4.2.10     500
Mo 02.09.2024 00:00:42     5.559      -1      530.733    95,5 FediScience.org           4.2.10     500
So 01.09.2024 00:00:07     5.560      +2      530.310    95,4 FediScience.org           4.2.10     500
Sa 31.08.2024 00:04:51     5.558       0      529.951    95,3 FediScience.org           4.2.10     500
Zack Labe (@ZLabe) · 11/2022 · Tröts: 2.414 · Folger: 10.074
Mo 09.09.2024 19:43
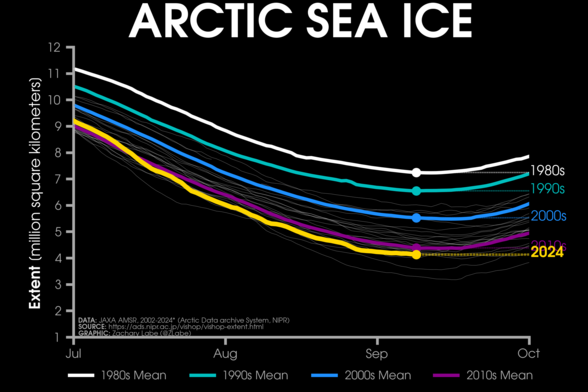
Have a good week. Here's your Monday ice update - #Arctic sea ice extent is currently the 4th lowest on record (JAXA data)...
• about 250,000 km² below the 2010s mean
• about 1,400,000 km² below the 2000s mean
• about 2,420,000 km² below the 1990s mean
• about 3,110,000 km² below the 1980s mean
Plots: https://zacklabe.com/arctic-sea-ice-extentconcentration/

Line graph time series of 2024's daily Arctic sea ice extent compared to decadal averages from the 1980s to the 2010s. The decadal averages are shown with different colored lines with white for the 1980s, green for the 1990s, blue for the 2000s, and purple for the 2010s. Thin white lines are also shown for each year from 2002 to 2022. 2024 is shown with a thick gold line. There is a long-term decreasing trend in ice extent for every day of the year shown on this graph between July and October by looking at the decadal average line positions.
[Öffentlich] Antw.: 0 Wtrl.: 12 Fav.: 9 · via Web