Zeitpunkt              Nutzer    Delta   Tröts        TNR     Titel                     Version  maxTL
Do 11.07.2024 00:00:34     9.862       0      541.041    54,9 Climate Justice Social    4.2.1... 5.000
Mi 10.07.2024 00:01:06     9.862      -1      540.201    54,8 Climate Justice Social    4.2.1... 5.000
Di 09.07.2024 00:00:51     9.863       0      539.257    54,7 Climate Justice Social    4.2.1... 5.000
Mo 08.07.2024 00:01:17     9.863       0      538.334    54,6 Climate Justice Social    4.2.1... 5.000
So 07.07.2024 00:01:12     9.863      +2      537.285    54,5 Climate Justice Social    4.2.1... 5.000
Sa 06.07.2024 00:01:06     9.861      +1      536.585    54,4 Climate Justice Social    4.2.1... 5.000
Fr 05.07.2024 00:01:07     9.860      -1      535.640    54,3 Climate Justice Social    4.2.1... 5.000
Do 04.07.2024 00:00:18     9.861       0      534.684    54,2 Climate Justice Social    4.2.9... 5.000
Mi 03.07.2024 00:00:14     9.861      -1      533.860    54,1 Climate Justice Social    4.2.9... 5.000
Di 02.07.2024 00:01:45     9.862       0      532.959    54,0 Climate Justice Social    4.2.9... 5.000
(@anlomedad) · 11/2022 · Tröts: 3.451 · Folger: 553
Do 11.07.2024 10:40
How much warming in the middle #Miocene 15million years ago came from methane?
Methane is not constrained at all for the Miocene.
But I did the maths –yet I also warn you: I am maths dyslexic. 😁
tldr: with assumed 10 times more wetlands than today and all of the remaining landmass assumed to be like today's tiny "wild rest",
CH4 emissions were 2124 Mt per year.
Which amounted to 6608 ppb CH4 in the atmosphere which in itself caused +2.1°C .
CO2 in 15Ma is not well constrained either. (see below)
I calculate 560ppm to have contributed 3°C (current science working theory for ECS ±1).
So methane 2.1°C and CO2 3°C on their own, omitting all other climate factors, caused +5.1°C in the Miocene.
The breakdown of the numbers follows. With links.
# CO2:
Hoenisch et al 2023 published meticulously revised CO2 values from global #d13C proxies https://paleo-co2.org , their considered-best proxies are all oceanic in origin.
The chart #1 of 1milion years 15 million years ago, shows #Hoenisch ' s CO2 proxies as the horizontal lines. I chose to fill the gaps with repeated values between the rare data points. So each line segment really is only 1 data point at its right-most end.
560 ppm CO2 seems an okay guess, no?
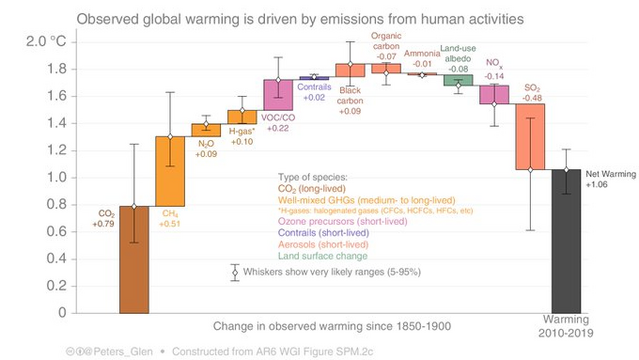
@Peters_Glen did a cool chart, more intuitive than the one in #AR6, I think. See pic 2 or his tweet where he plots the various greenhouse gases with their warming contribution 2010-2019: https://x.com/Peters_Glen/status/1431873249449680901
The average CH4 concentration in the decade 2010-2019 was 1840ppb (NOAA) and caused +0.51°C as per Glen's chart.
From Glen's chart follows my secret methane formula 😁
1 Mt methane <=> 3.111 ppb <=> 0.001 ºC
If emissions in 15Ma were 2124 Mt CH4 (see #landmass below), it resulted in 2.12°C at a concentration of 6608 ppb.
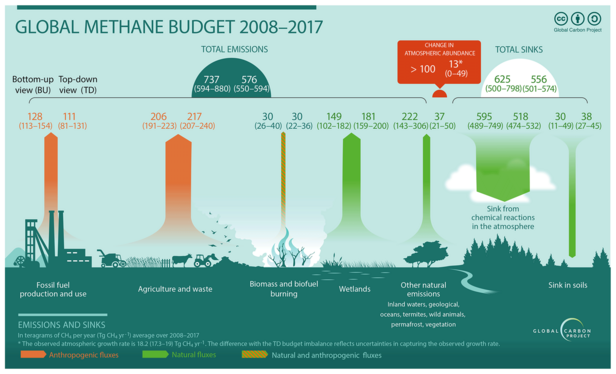
According to the Global Methane Budget by #GlobalCarbonProject : https://essd.copernicus.org/articles/12/1561/2020/
emissions from the "wild rest" 2008-2017 were 222 Mt CH4 annually . See picture 3.
The wild rest today is 54mio km2, according to #OurWorldInData https://ourworldindata.org/global-land-for-agriculture
Wild rest: 222 Mt CH4 from 54mio km2 = 4.1 t CH4 / km2.
Emissions from wetlands 2008-2017 were 180Mt CH4 (Tg=Mt) .
They cover 4.37% of the total land mass: https://ourworldindata.org/grapher/coverage-of-wetlands?tab=chart&country=~OWID_WRL
4.37% of 141mio km2 total is:
Wetlands 6.2mio km2.
Wetlands: 180 Mt from 6.2 km2 = 30 t CH4 / km2.
In 15Ma Miocene, 10 times more wetlands would have been
62 mio km2.
And
wild rest 79 mio km2.
wetlands 62mio km2 times 30t CH4 = 1800 Mt CH4
wild rest 79 mio km2 times 4.1t CH4 = 324 Mt CH4.
Wetlands plus wild rest:
1800 Mt + 324 Mt = 2124 Mt CH4
secret methane formula:
1 Mt methane <=> 3.111 ppb <=> 0.001 ºC
2124 Mt <=> 6608 ppb <=> 2.12°C
Why do I assume that wetlands were 10x more than today, tho? Why not 15, 20 or 5 times more?
Dunno. Well, humans have unwetted lotsa wetlands since the invention of agriculture in the #Holocene. (Btw, the area of today's dried peatland alone emits 2Gt CO2 per year. See table on dried wetland areas and their emissions GHG:
https://www.nature.com/articles/s41467-020-15499-z/tables/2 #Günther et al 2020, based on IPCC guidelines for wetlands https://www.ipcc.ch/publication/2013-supplement-to-the-2006-ipcc-guidelines-for-national-greenhouse-gas-inventories-wetlands/ )
Hard to tell what area was covered by wetlands in the previous interglacial 126thsd years ago.
And in the middle Miocene, 15Ma?
My thinking goes like this:
The #Sahara was still forested 15Ma. As was the Gobi Desert probably. The prairies in the US were still forested, even #Greenland and #Antarctica. Northern #Russia had much more land mass back then, too.
Some of the different vegetation compared to pre-Holocene was due to different topography: the Rockies and Alpes were much, much lower, the high mountain ranges in East Asia didn't exist. #Australia was 15° further South. See also #Steinthordottir et al 2021 in "Miocene The Future Of The Past https://agupubs.onlinelibrary.wiley.com/doi/full/10.1029/2020PA004037
And the whole special Miocene issue:
https://agupubs.onlinelibrary.wiley.com/doi/toc/10.1002/(ISSN)2572-4525.Miocene1
All land area had gap-less biomes growing. Mostly forests. And what do forests do? Away from the coast, within the continents, forests control the hydrological cycle, how much evaporates and how much it rains. All biomes do, but forests most.
The more forests there are, the more it rains. Uninterrupted plant cover with its propagating rain cycle hinders deserts from forming in the heart of the continents, as well.
Also, air holds 7% more water per 1°C warming, raising the potential rain amount.
Now, if it rains a lot, and depending on the topography, land is inundated temporary, seasonally or permanently, methane-producing microbes in the soil get to work presto, eat carbon and fart CH4.
The warmer it is, the more the microbes work.
But why 10x more wetlands?
Why not 7 or 15x?
Dunno. 10 feels right. And 6608ppb is nicely close to a previous guesstimate of mine that CH4 concentration might have been 7000 ppb in mid Miocene.
Maybe 400ppb came from huge animals, happily roaming among giant trees.
Brazil's Giant Sloth? The "wild rest" in the Miocene was HUGE! And cute.

Line chart of climate factors 1 million years 15 million years ago. Milankovic cycles are the background of the chart. The foreground are several CO2 proxies from Hoenisch's paleoCO2-archive. Also sea level by Miller et al 2020 and by Rohling et al 2021.And global surface air temperature by Westerhold et al 2020. Westerhold's surface air temperature peaks at 20.6 °C about 15.6 million years ago and undulates around 18°C the rest of the time. The global average in year 2023 was 14.9 by the way. So 15 million years ago, according to Westerhold, it might once have been 6°C warmer than the completey gobsmacking bananas year 2023.

The 2010-2019 contribution to warming by greenhouse gases . Glen's chart shows methane at +0.51°C, CO2 at +0.79°C and SO2 at -0.54°C. Various other GHG add or subtract warming. Resulting average warming 2010-2019 was 1.06°C.

Global Methane Budget 2008-2017 as schematics in two different analysis pathways: top down and bottom-up. Both vary in their emission and sink values, implying the uncertainty around current methane emission and budget.
[Öffentlich] Antw.: 0 Wtrl.: 0 Fav.: 0