Zeitpunkt              Nutzer    Delta   Tröts        TNR     Titel                     Version  maxTL
Mo 22.07.2024 00:00:33     9.871       0      548.116    55,5 Climate Justice Social    4.2.1... 5.000
So 21.07.2024 00:00:00     9.871      +1      546.944    55,4 Climate Justice Social    4.2.1... 5.000
Sa 20.07.2024 00:01:12     9.870       0      546.136    55,3 Climate Justice Social    4.2.1... 5.000
Fr 19.07.2024 14:00:42     9.870      +1      548.300    55,6 Climate Justice Social    4.2.1... 5.000
Do 18.07.2024 00:01:09     9.869      +1      547.299    55,5 Climate Justice Social    4.2.1... 5.000
Mi 17.07.2024 00:01:11     9.868       0      546.449    55,4 Climate Justice Social    4.2.1... 5.000
Di 16.07.2024 00:01:10     9.868       0      545.594    55,3 Climate Justice Social    4.2.1... 5.000
Mo 15.07.2024 00:01:09     9.868       0      544.708    55,2 Climate Justice Social    4.2.1... 5.000
So 14.07.2024 00:01:08     9.868      +3      543.813    55,1 Climate Justice Social    4.2.1... 5.000
Sa 13.07.2024 00:00:07     9.865       0      542.804    55,0 Climate Justice Social    4.2.1... 5.000
Bread and Circuses (@breadandcircuses) · 11/2022 · Tröts: 4.002 · Folger: 9.396
Mo 22.07.2024 14:33
THIS should be front-page news every day.
THIS should be the primary focus of every major world leader.
But it's not.
Instead, all we get is month after month of more Business As Usual.
‼️ 🚨 ‼️ 🚨 ‼️ 🚨 ‼️ 🚨 ‼️ 🚨 ‼️
Dr. Robert Rohde (@RARohde) delivers the latest update on our global climate emergency:
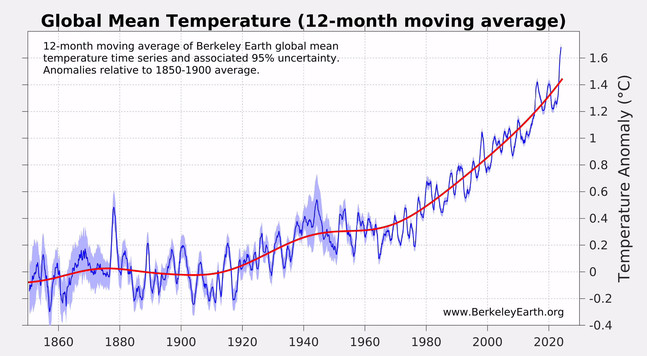
"The last 12 months were each at least 1.5°C (2.7°F) warmer than Berkeley Earth's 1850-1900 baseline. This brings the 12-month moving average of Earth's global temperature to a record high of +1.68°C (+3.02°F) above the 1850-1900 baseline, far surpassing previous short-term warming events."
See ➡️ https://fediscience.org/@RARohde/112824106977970378
Learn more ➡️ https://berkeleyearth.org/june-2024-temperature-update/
#Science #Environment #Climate #ClimateChange #ClimateCrisis #ClimateEmergency

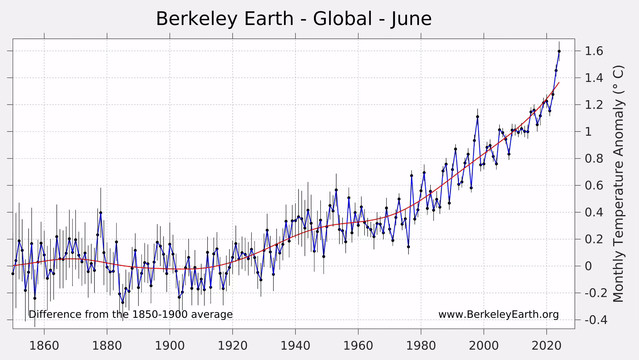
Line graph shows global monthly temperature anomaly from 1850 through the present. The trend is mostly steady until about 1940 when it starts a slow upward trend which steepens starting around 1980 and reaches an all-time high in June 2024 of more than 1.6° C above the pre-industrial average.

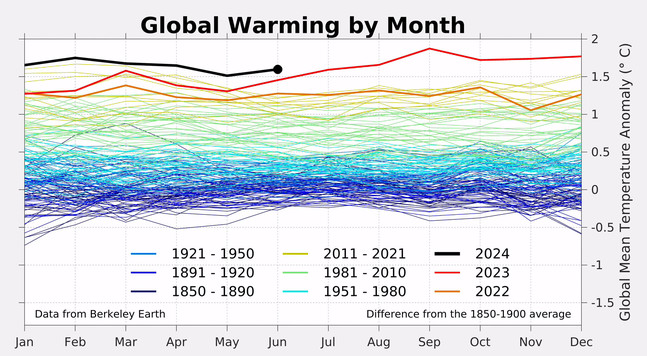
A series of lines shows global warming by month for every year from 1850 through the present. At the top, the warmest months are all from the past two years, with 2024 setting records every single month.

Line graph shows 12-month moving average of the global mean temperature from 1850 through the present. The trend is mostly smooth until about 1960 when it starts an upward trend that reaches an all-time high in June 2024 of 1.68° C above the pre-industrial average.
[Öffentlich] Antw.: 3 Wtrl.: 25 Fav.: 17 · via Web