Zeitpunkt              Nutzer    Delta   Tröts        TNR     Titel                     Version  maxTL
Di 30.07.2024 00:00:30     9.877      +1      555.902    56,3 Climate Justice Social    4.2.1... 5.000
Mo 29.07.2024 00:01:12     9.876       0      555.053    56,2 Climate Justice Social    4.2.1... 5.000
So 28.07.2024 00:00:27     9.876      +1      554.241    56,1 Climate Justice Social    4.2.1... 5.000
Sa 27.07.2024 00:01:12     9.875      +1      553.191    56,0 Climate Justice Social    4.2.1... 5.000
Fr 26.07.2024 00:01:08     9.874      +2      552.199    55,9 Climate Justice Social    4.2.1... 5.000
Do 25.07.2024 00:00:00     9.872       0      550.974    55,8 Climate Justice Social    4.2.1... 5.000
Mi 24.07.2024 00:01:07     9.872      +1      550.210    55,7 Climate Justice Social    4.2.1... 5.000
Di 23.07.2024 00:01:01     9.871       0      549.028    55,6 Climate Justice Social    4.2.1... 5.000
Mo 22.07.2024 00:00:33     9.871       0      548.116    55,5 Climate Justice Social    4.2.1... 5.000
So 21.07.2024 00:00:00     9.871       0      546.944    55,4 Climate Justice Social    4.2.1... 5.000
(@anlomedad) · 11/2022 · Tröts: 3.689 · Folger: 562
Di 30.07.2024 09:57
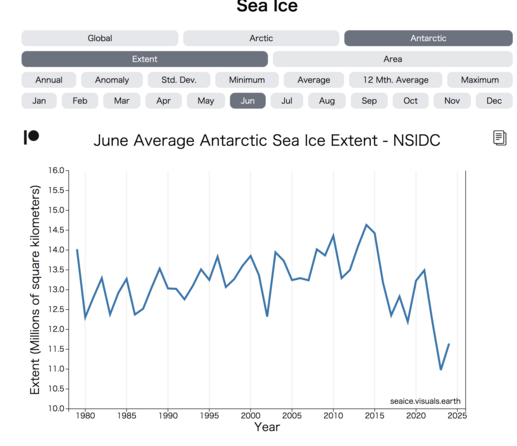
"It flickers, then it tips" comes to mind seeing how Antarctic June sea ice flickered 2003, followed by an abnormal rise, and now the system collapses.
@kevpluck has interactive seaice charts with various options https://seaice.visuals.earth
It looks like the system change, ie winter #seaice in #Antarctica didn't grow as fast as it should, began 2017. The drop from 2014 to 2017 near-equals the drop from 2021 to 2023.
Wrt "It flickers, then it tips":
A press release for a recent sediment study spanning 620 thousand years of droughts in the Ethiopian rift summed up the dynamics with "It flickers then it tips".
( Here's the authors' explanations in normal layman's prose if you're interested: https://theconversation.com/africa-dramatically-dried-out-5-500-years-ago-our-new-study-may-warn-us-of-future-climate-tipping-points-229323 #Thraut 2024.
Their sediment analysis shows how the green Sahara flickered and tipped into a desert 5.5thsd years ago. My belly says: AMOC related...)
The sentence is so gripping that I think of it all the time now.
cc @ZLabe

line plot for Antarctic June sea ice extent since 1979. From start to 2014, sea ice in June was about 13 million square km with annual ups and downs. One deep dive in 2003 to 12.3 km2. 2003 was also Europe's year of extreme heat deaths. A slight increase is also noticeable up to 14.4mio km2 in 2014. Then the drop to ~ 12mio km2 by 2017, followed by a few ups and downs and another drop starting in 2021, reaching all-time low extent in June 2023 of 11 mio km2. Source: https://seaice.visuals.earth
[Öffentlich] Antw.: 0 Wtrl.: 0 Fav.: 0